Showing posts with label Magnetic resonance spectroscopy. Show all posts
Showing posts with label Magnetic resonance spectroscopy. Show all posts
Thursday, August 13, 2009
Tuesday, August 4, 2009
MRS technology


 Pre and Post op CT scan for comparison


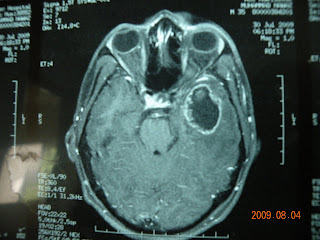
Case of ring enchancing lesion in MRI .
Patient was treated as abscess in Medicine Dept and referred to us. We did MRS which show choline peak characteristic of tumor . In this case MRI scanning supported by MRS was suggestive of glioma.
Case was operated Pterional craniectomy with sylvian fissure fissure approach. Cystic tumor mass from temporal lobe was resected.
Friday, July 24, 2009
Brain Abscess Or Tumor


Sometimes its so confusing to distinguish brain abscess and brain tumor on scans . Ring enchancing lesion on scan.
MRI spectroscopy helps to distinguish between two
What is Magnetic Resonance Spectroscopy?
Simply put, MRS is a quantitative method of display of non-aqueous proton signals that correspond to certain biological molecules in the brain.
Magnetic resonance imaging (MRI) uses water protons to create images. Very sophisticated and detailed images of the brain are produced based on the fact that different tissues within the brain have different water content. The hydrogen nuclei (protons) that are not in water (non-aqueous protons) are distributed throughout the hundreds of biologically significant molecules of the living brain. These molecular radio-signals are not visible on standard MR images because they are overwhelmed by the high signal derived from the aqueous protons. The non-aqueous molecules each has a unique radio-frequency specific to the chemical itself and distinct from the frequency of water protons. The amplitude or strength of these radio-frequencies is dependent on their concentration in the volume of interest, each at their discrete radio-frequence position. This allows a graph to be displayed that shows the relative peaks of amplitude for each of several biological molecules. These peaks are more readily detected and displayed if the signal from aqueous protons is suppressed.
What is MR Spectrum?
The "spectrum" is a graph of the relative concentrations of these molecules based on their discrete radio-frequency signal, which is shifted away (chemical shift) from the water signal the MRI uses. A high peak means that the molecule at that RF location exists in greater concentration than an adjacent low peak. To be precise, it is the area under the peak that is relevant. Applying appropriate calibrations, the concentration of a given metabolite is calculated from the peak area. The peak locations correspond to specific molecules such as glucose, creatine, lactate etc, however peaks from non-identical molecules may overlap. In practice, the peak position identifies the brain metabolite. The combination of peak locations (chemical shift compared to water) and heights provides a biochemical fingerprint of the volume of interest (VOI).
The "spectrum" is a graph of the relative concentrations of these molecules based on their discrete radio-frequency signal, which is shifted away (chemical shift) from the water signal the MRI uses. A high peak means that the molecule at that RF location exists in greater concentration than an adjacent low peak. To be precise, it is the area under the peak that is relevant. Applying appropriate calibrations, the concentration of a given metabolite is calculated from the peak area. The peak locations correspond to specific molecules such as glucose, creatine, lactate etc, however peaks from non-identical molecules may overlap. In practice, the peak position identifies the brain metabolite. The combination of peak locations (chemical shift compared to water) and heights provides a biochemical fingerprint of the volume of interest (VOI).
MRS demonstrate increase choline peak in case of tumors while abscess dont whereas abscess demonstrate acetate and aminoacid resonance
Subscribe to:
Posts (Atom)


